Sweetwater CRA — Project Review
Confidential draft prepared for City review. Please enter the review passcode to continue.
Incorrect passcode — please try again.
Confidential draft prepared for City review. Please enter the review passcode to continue.
The physical, economic, environmental, and regulatory baseline of the ~476-acre study area — the foundation the CRA Plan is built on. Draft · 03.24.26
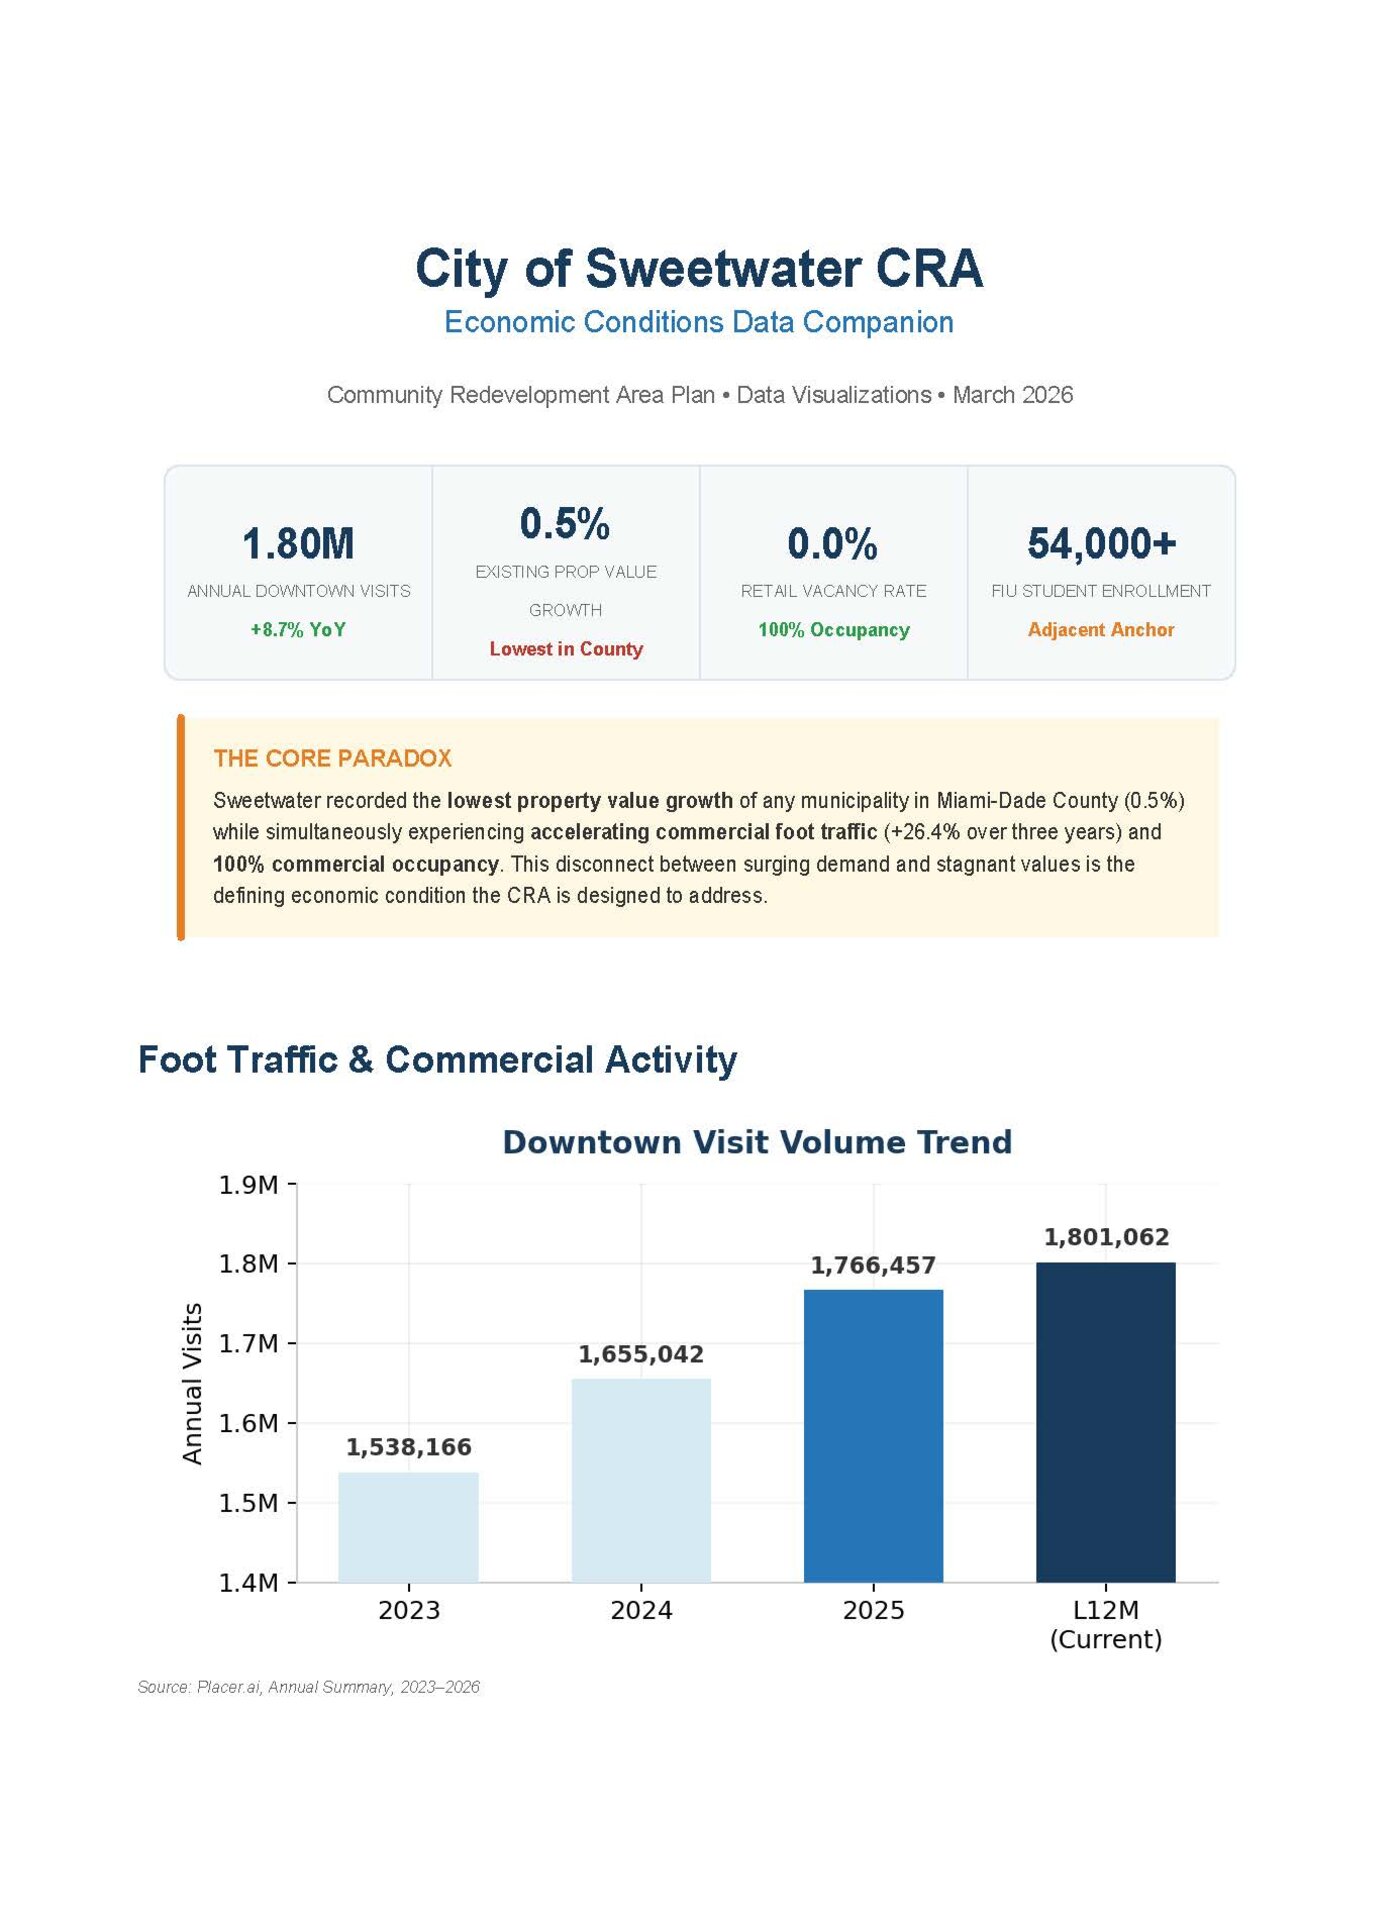
Sweetwater recorded the lowest property-value growth of any municipality in Miami-Dade County (0.5%) while simultaneously experiencing surging commercial foot traffic and 100% commercial occupancy. This disconnect between rising demand and stagnant value is the defining condition the CRA is designed to address.
Encompassing roughly 476 acres at the historic center of the City, the study area includes the key corridors of SW 109th Avenue, W Flagler Street, and SW 107th Avenue, and its critical connection to FIU. The assessment evaluates land use and zoning, mobility, infrastructure capacity, environment, housing, public space, and market trends.
Regional position: western Miami-Dade between the Dolphin Expressway (SR 836), Florida's Turnpike, and SW 8th Street — 10–15 min to Miami International Airport and adjacent to Dolphin Mall, Doral, and the ~1,200-acre Beacon Lakes employment district (Amazon, Goya, Telemundo).
Environmental factors: portions fall within Flood Zone AH (shallow flooding), and a 68.57-acre designated brownfield in the former Li'l Abner area presents both a remediation need and a major incentive-eligible redevelopment opportunity. Open space is limited, served today mainly by Ronselli Park and the James M. Beasley Linear Park.
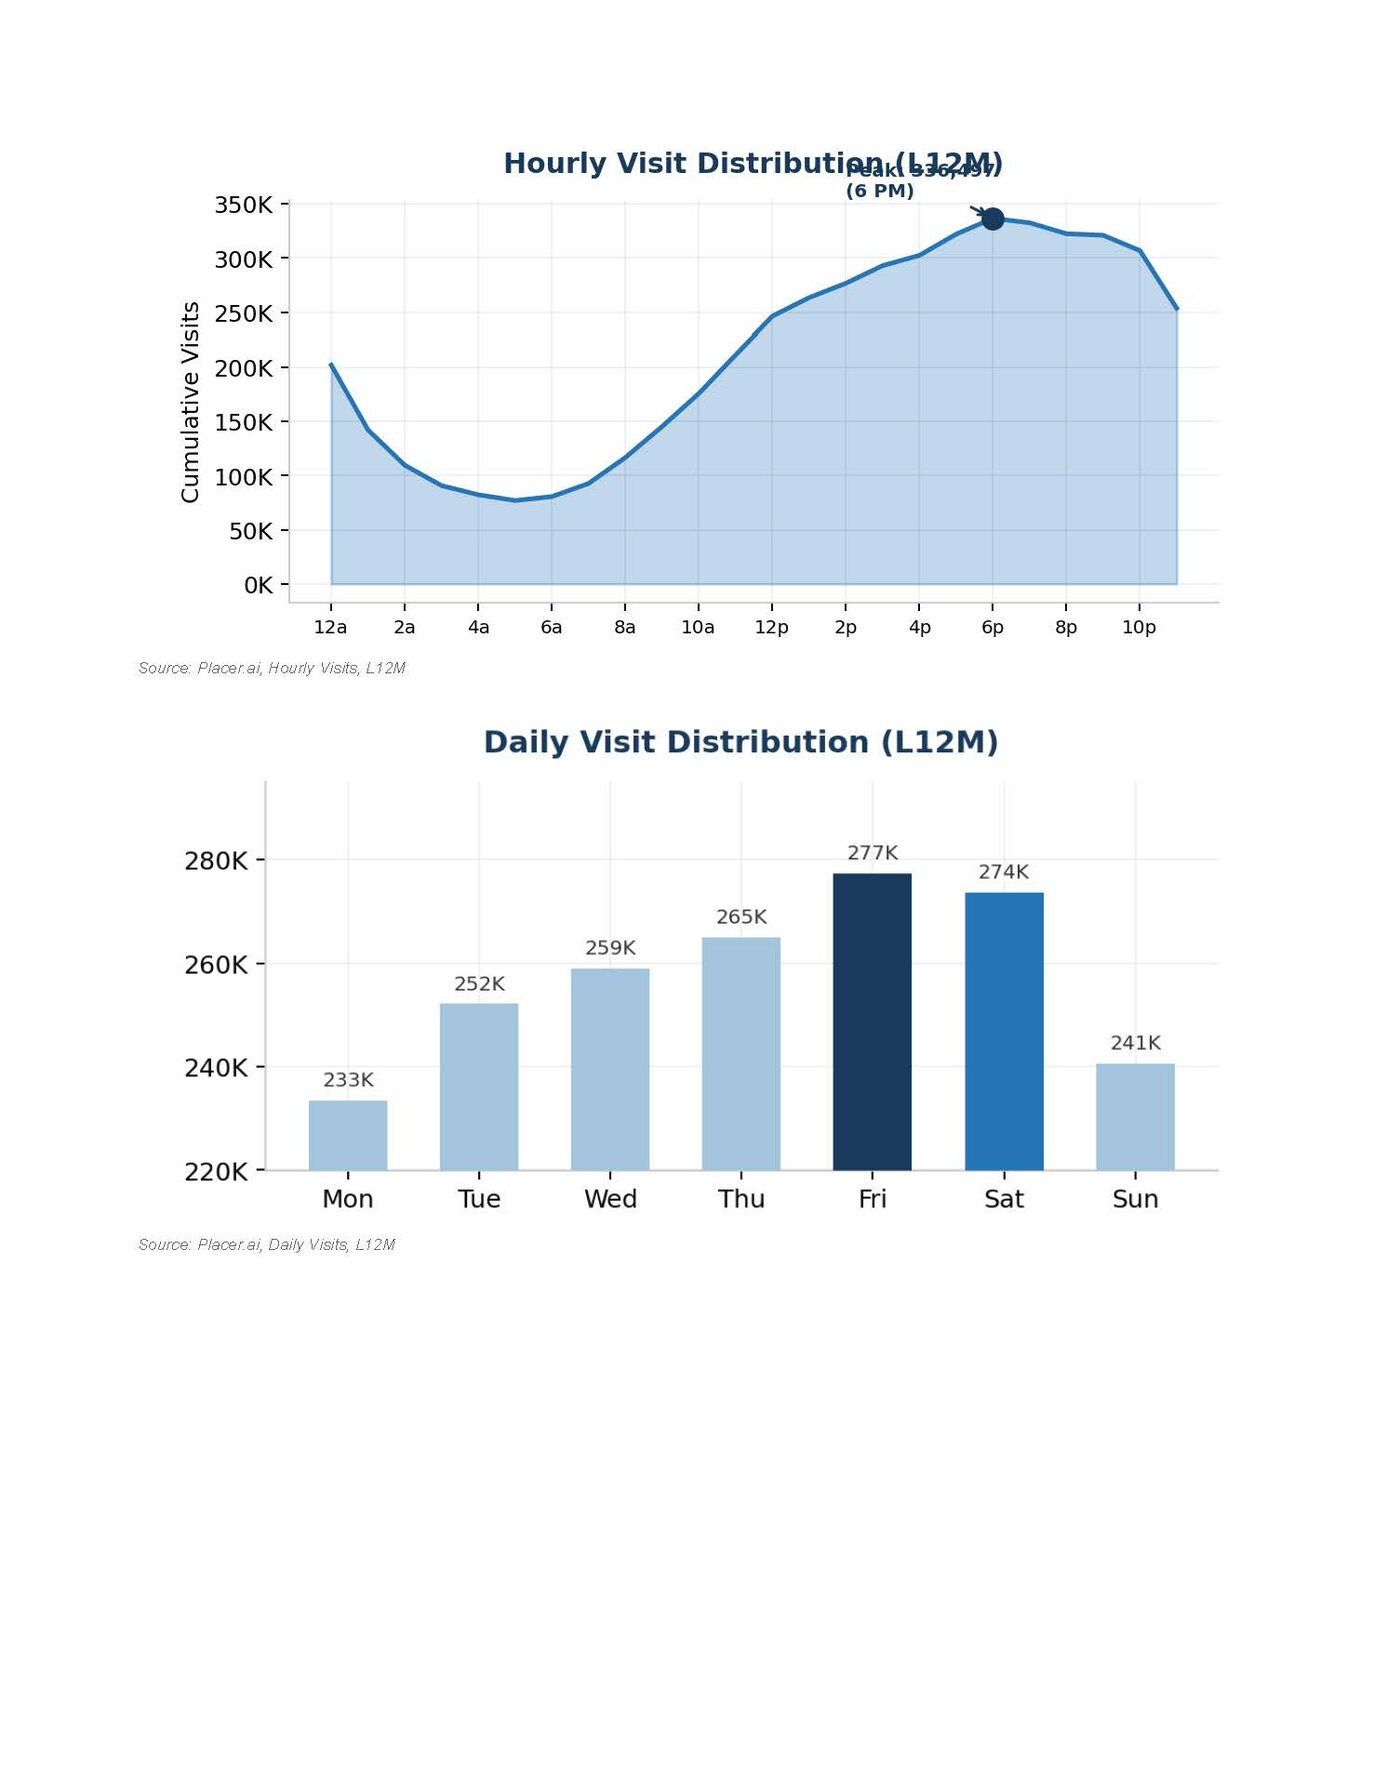
Placer.ai data over the last twelve months shows consistent growth, an evening peak, and the strongest activity Thursday through Saturday — the demand base a Main Street strategy can build on.